In this article, I show how Android memory leaks lead to jank, freezes and ANRs more often than they lead to OutOfMemoryError crashes.
Navigation Latency
At Square, we've been tracking a User-Centric performance metric: Interaction Latency. We track this on every app navigation (example implementation: Tap Response Time: Jetpack Navigation 🗺).
In other words, for every navigation, we report a latency metric that measures the duration from when the tap was received to when the display was updated, i.e. how much latency users perceive.
val durationMillis = frameCommitted - actionUpMotionEvent.eventTime
analytics.logNavigation(
  originScreen,
  destinationScreen,
  durationMillis
)
Memory usage on navigation
Resource consumption metrics like memory usage are often reported as time series, which isn't useful when trying to correlate app usage with memory leaks.
In January 2023, Pavlo Stavytskyi published Detecting Android memory leaks in production on the Lyft Engineering blog.
One interesting idea in the article was to report memory usage metrics on every screen navigation instead of as a time series because memory leaks tend to accumulate with app usage.
Let's update our navigation analytics to add memory usage:
val runtime = Runtime.getRuntime()
val javaHeapUsage = runtime.totalMemory() - runtime.freeMemory()

analytics.logNavigation(
  sourceScreen,
  destinationScreen,
  durationMillis,
  javaHeapUsage
)
Memory limit
If Android devices had infinite memory, memory leaks wouldn't be an issue. Android devices have limited RAM, every app is allowed to use only a subset of the device RAM for its Java heap, and memory leaks become an issue when memory usage is close to the limit. That limit is configured per device and can be queried with Runtime.maxMemory():
val javaHeapLimit = Runtime.getRuntime().maxMemory()

analytics.logNavigation(
  sourceScreen,
  destinationScreen,
  durationMillis,
  javaHeapUsage,
  javaHeapLimit
)
Example leaky session
We can now graph memory usage over time for a single session, where each data point in a single navigation. Here's a real example session with 1591 navigations where we see memory usage grow over time:

Notice how Java heap usage is constantly jumping up & down as the GC runs, but the trend is upward which indicates a memory leak. Applying a linear regression shows a slope of +146 KB per navigation.
Memory usage & Navigation Latency
Let's add Navigation Latency to the graph:
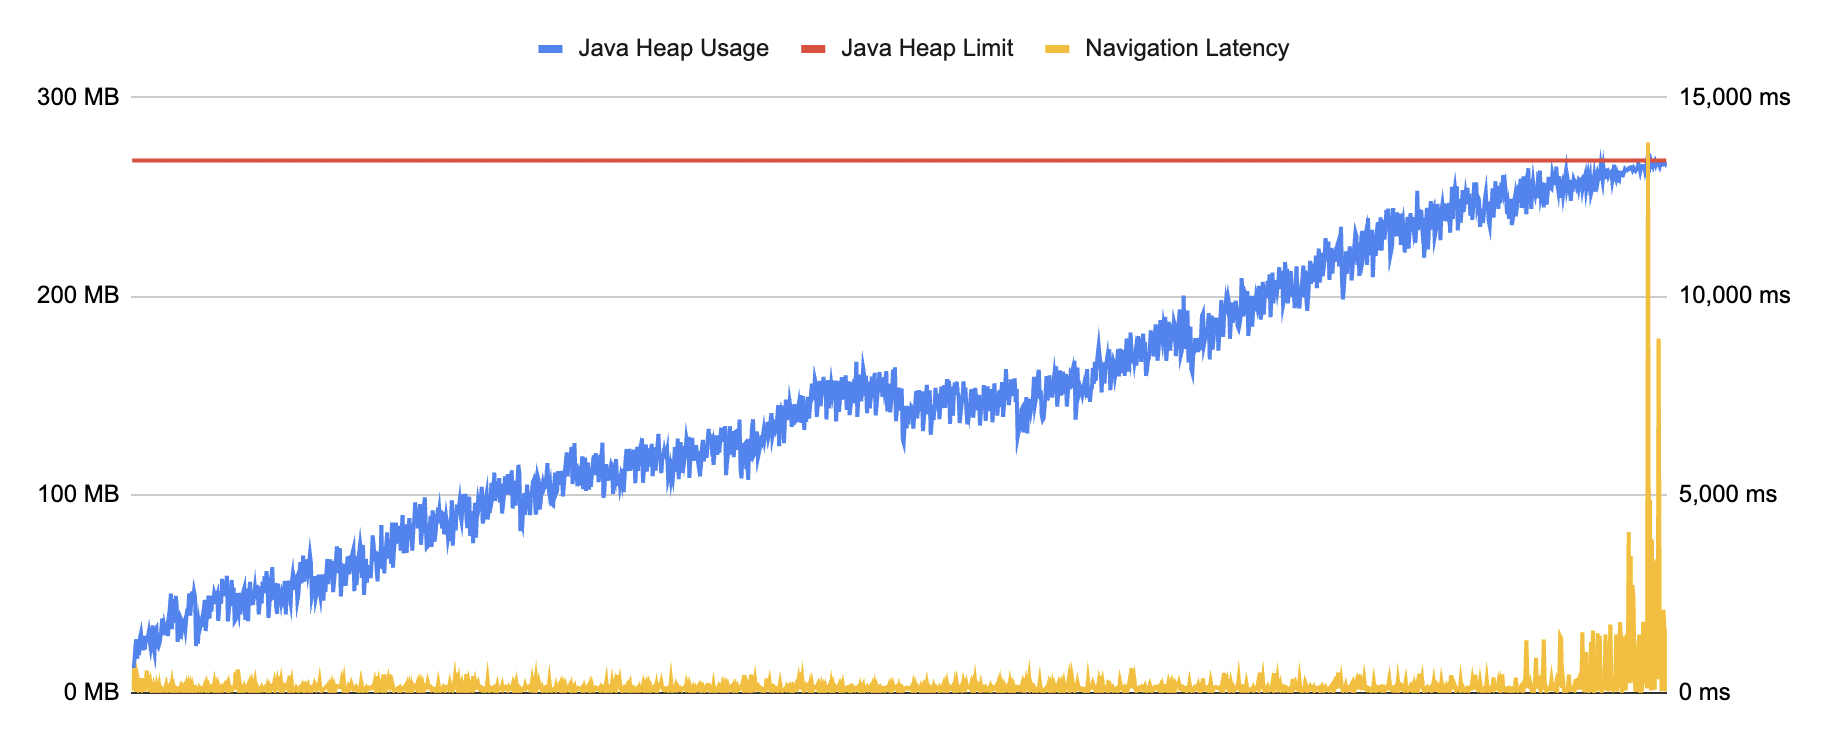
Notice how Navigation Latency is fairly flat throughout the session until memory usage gets close to the memory limit, at which point Navigation Latency shoots up. We can zoom in on the last 200 navigations:
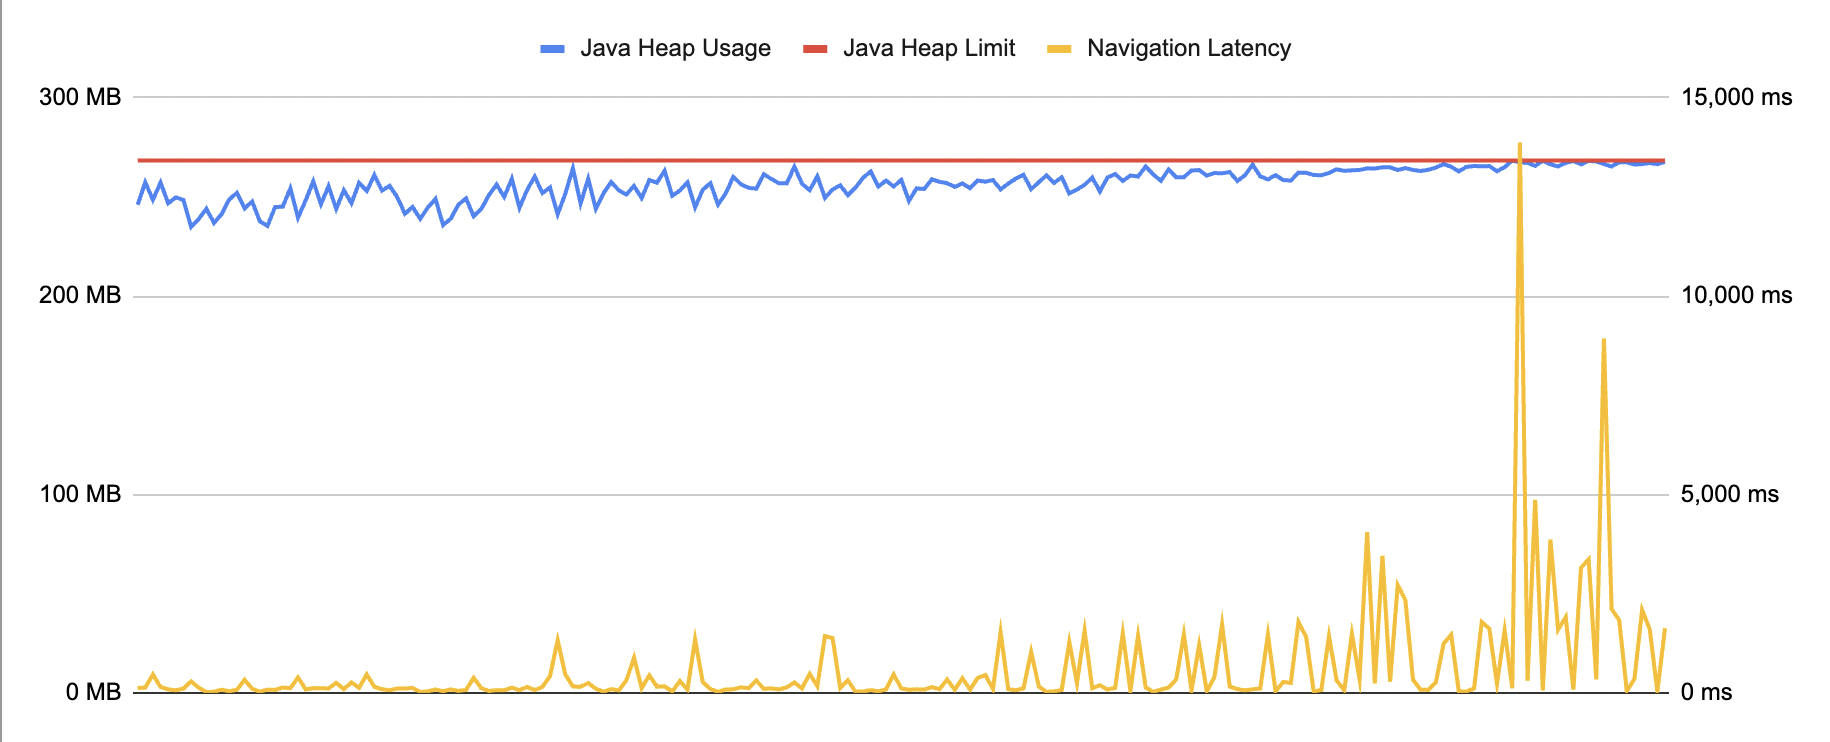
In this example session, the UI freezes up for seconds at a time while the GC is blocking the main thread to reclaim memory. This starts happening when memory gets within 18 MB of the limit.
The progressive impact of memory leaks
As Java heap memory gets close to the app memory limit, the impact of memory leaks is more and more noticeable.
First, small GC pauses cause animation jank.
Then longer GC pauses cause increasingly longer UI freezes, for seconds at a time.
If the main thread freezes for more than 5 seconds while touch events are pending dispatch, the app triggers an Application Not Responding (ANR) error.
Eventually, there's so little memory left that we can't allocate new objects and the app crashes with an OutOfMemoryError exception.
Missing the real impact of memory leaks
If you have crash reporting in place and a process to fix top crashes, well done! Unfortunately, you can't just look at OutOfMemoryError crashes to decide when to look into fixing Java memory leaks, for two reasons:
Crash reporting tools typically group crashes by identical stack traces and provide a count by crash group. When memory is low an OutOfMemoryError can be thrown from anywhere in the app code, which means that every OutOfMemoryError potentially has a different stack trace. Instead of one crash entry with 1000 crashes, OutOfMemoryError crashes get reported as 1000 distinct crashes and hide in the long tail of low-occurring crashes.
As the app slows down and freezes for several seconds, mobile users will either stop using it, or kill it and restart it. So the app might never crash with OutOfMemoryError even though the customer impact is real.
Takeaways
Android memory leaks progressively lead to jank, then freezes, then ANRs and eventually OutOfMemoryError crashes (if the user hasn't already left or killed the app).
When an ANR report shows a stacktrace that doesn't seem like it could actually cause an ANR, you should look at memory usage and memory limit. If memory is close to the limit, the ANR is probably happening because the GC is blocking the main thread.
To avoid these performance issues, you should systematically fix all memory leaks surfaced by LeakCanary.
By combining memory usage & memory limit data with performance data in production, you can surface the relationship between memory leaks & performance.
- While I can't share the actual numbers, we saw a direct correlation between user activity, leak rate, and freeze / ANR rate.
A linear regression of memory usage over navigations per session can show whether a session has a memory leak, and how bad the leak is.