👋 Hi, this is P-Y, over the last three years I've been steering Square's focus on mobile performance and building a framework for thinking about it and prioritizing work. In this article I share my approach, let me know what you think!
Useful metrics
As an app codebase and user base grows, it becomes harder for product teams to evaluate the performance of an app just by playing with it.
When talking about performance, it's important to be precise and to refer to performance in terms of objective criteria that can be quantitatively measured. These criteria are known as metrics.
But just because a metric is based on objective criteria and can be quantitatively measured, it doesn't necessarily mean those measurements are useful.
Source: web.dev
Useful for what? Product teams deal with competing priorities, they need a signal to know when and where to prioritize performance work, i.e. they need to know when poor performance is impacting their customer's experience and ultimately driving business metrics down.
Mobile performance metrics often take inspiration from the backend world and measure resource usage (CPU usage, memory usage) and workload durations (how long it takes to run a piece of code).
While app performance directly impacts User Experience, metrics surfacing high CPU usage or slow database reads are not useful measurements to convey the actual user experience. They're not user-centric.
For example, when exporting an Insta360 video, as a customer I want the app to maximize GPU and CPUs usage so that the export goes faster.
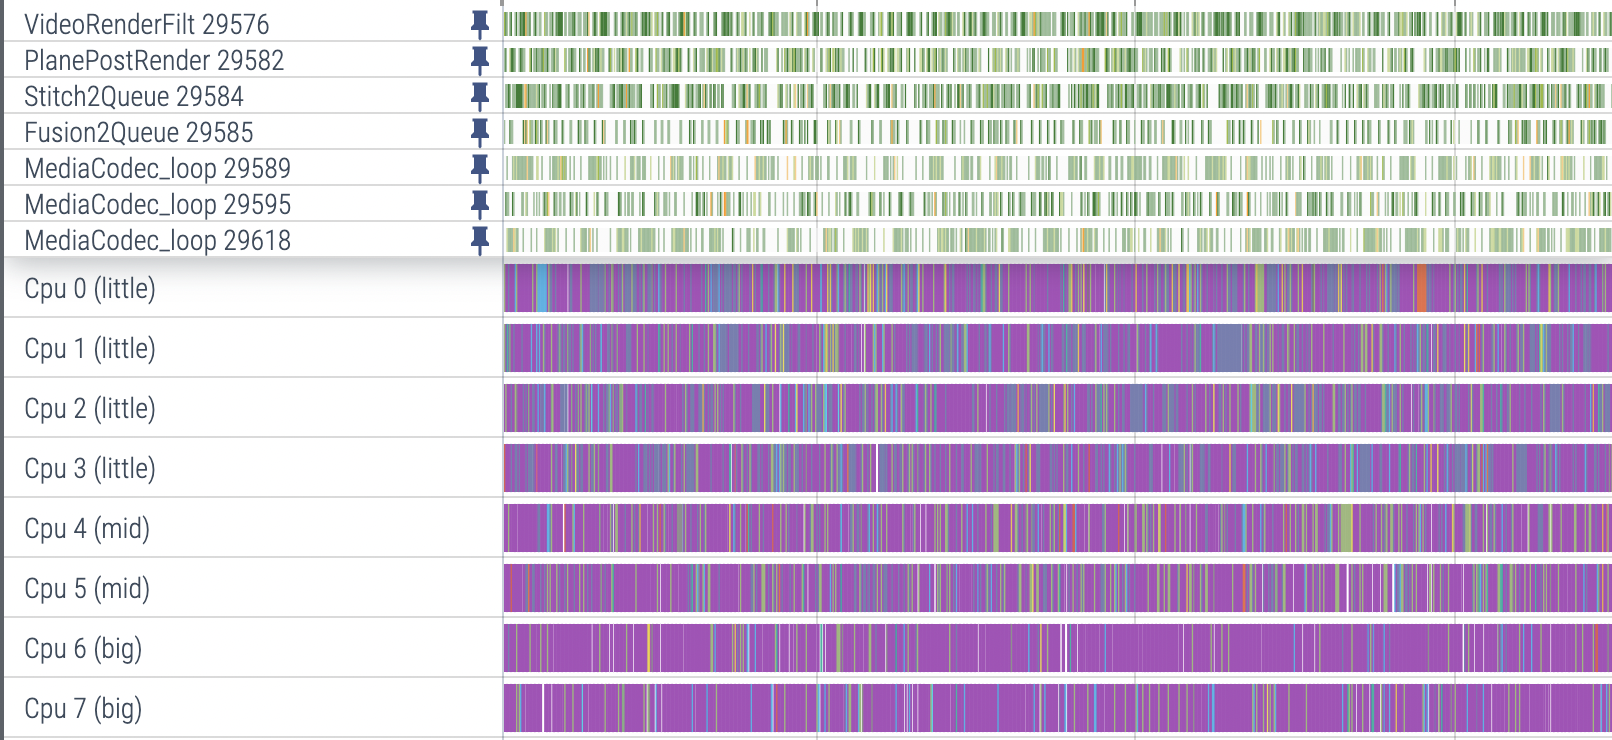
Insta360 threads (in purple) scheduled on all CPUs while exporting a video.
Mobile app teams should primarily track user-centric performance metrics that represent the experience of using the app.
This helps product teams make better performance investments. Unlike technical metrics, we can't dance around user-centric performance metrics: while we could argue on the right amount of memory usage or the right duration of a database query, we can't argue against a metric that demonstrates a bad customer experience.
Of course, app teams should still track resource usage and technical workload durations as secondary metrics, to help understand the components influencing user-centric performance metrics.
There are two broad categories of user-centric performance metrics:
Smoothness metrics, which track whether motion on screen is perceived as janky.
Responsiveness metrics, which track the delay between a user action and a visible response from the system.
Human-based thresholds
User experience research suggests that humans do not perceive latency improvements beyond specific thresholds: 11 ms for the latency of on-screen drag motion (smoothness) and 69 ms for the latency of on-screen tap interactions (responsiveness).
Apple's app responsiveness documentation makes a similar distinction:
An app that responds instantly to users’ interactions gives an impression of supporting their workflow. When the app responds to gestures and taps in real time, it creates an experience for users that they’re directly manipulating the objects on the screen. Apps with a noticeable delay in user interaction (a hang) or movement on screen that appears to jump (a hitch), shatter that illusion. This leaves the user wondering whether the app is working correctly. To avoid hangs and hitches, keep the following rough thresholds in mind as you develop and test your app.
Smoothness
Any sort of screen motion requires frame updates to be synced with the display refresh rate, otherwise humans notice jank.
Screen motion can be interactive or non-interactive. Interactive is when a finger is touching the display and the UI is following it, i.e. a drag (slow scrolling a list, or drag & drop). Non-interactive can be animations or a fling based scroll.
Jank on interactive screen motion has a stronger negative impact on user experience than jank on non-interactive screen motion.
Smoothness is typically measured by reporting frame rate and missed frames. Keep in mind that smoothness only matters when there's actual motion on screen, and matters more when that motion is interactive.
For example, it's actually ok to take 50 ms to update the UI in response to a tap. A tap isn't a drag, there's no motion. However, if after 50 ms we start an animation to open the new UI, that animation should render every frame.
Responsiveness
A responsiveness metric is any metric that tracks the delay between a user action and a visible response from the system, i.e. an interaction. Here are a few examples:
Launching an app by tapping its icon in the launcher.
Bringing an app back to the foreground from Recents.
Tapping a Like button and seeing a counter increase.
Tapping a list item to open up its details in a new screen.
Typing with a connected hardware keyboard.
Using a connected watch to trigger taking a picture from a phone.
Responsiveness thresholds
We have different expectations for how long these interactions should take: we expect an app launch to take significantly longer than seeing a counter increase after tapping a Like button.
These different expectations come from our ability to do pattern matching. Humans are really good at picking up a trend and detecting outliers. If most apps launch in 2 seconds, users immediately notice apps that launch in 500 ms or 5 seconds.
This means we can have 2 responsiveness thresholds per metric:
These thresholds can't be universal, they're highly context-specific (low-end vs high-end devices, which other apps the users are exposed to, etc).
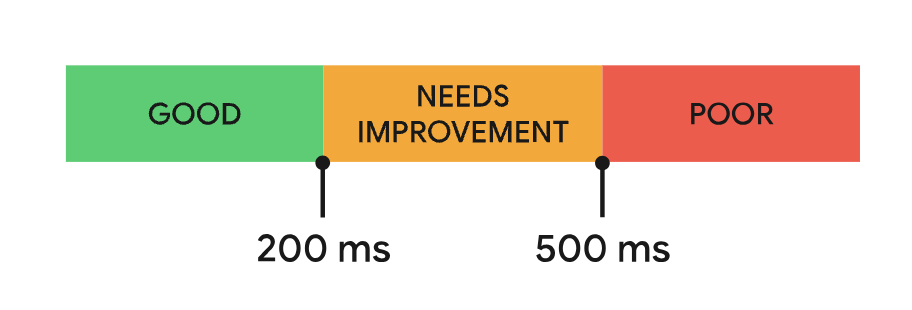
A similar approach can be found in the Interaction to Next Paint (INP) documentation, where two duration thresholds (200 ms & 500 ms) define a score of GOOD / NEEDS IMPROVEMENT / POOR for each measured sample.
I have used similar thresholds at Square but wasn't sure how I could turn these into a single performance number, so I mostly focused on the P90 instead.
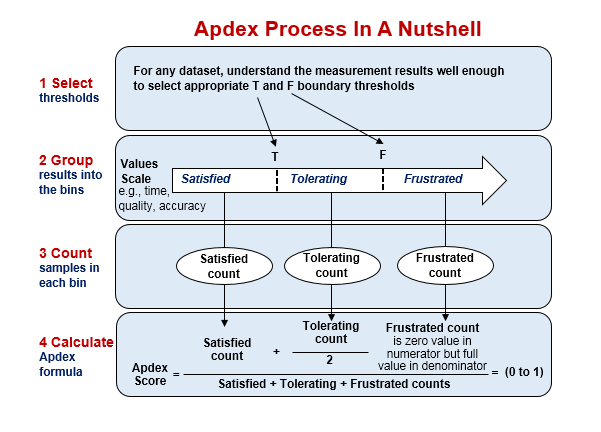
Ty Smith just pointed me to the Apdex score which also defines two thresholds to splits samples in 3 buckets (Satisfied, Tolerated, Frustrated) then provides a score as a weighted average of counts.
Critical metrics
App launch time is critical when customers use an app for short amounts of time. App launch time is less critical when customers intend to use an app continuously for a long period of time (e.g. a Lyft Driver app, a point-of-sale app, a Check-In app for visitors, etc).
After taking your order in a restaurant, a waiter needs to be able to input it in the point-of-sale app really quickly without thinking and relies on muscle memory. This requires a predictable UI and consistent tap latency. In that context, tap latency is critical whereas app launch time (which happens once a day) is not.
Similarly, scroll smoothness is probably more critical for a feed than for a list of settings
Product teams should identify which interactions are critical for their customers, then use responsiveness thresholds to prioritize performance work.
Biais in aggregates
Production metrics yield large volumes of data, and product teams look at aggregate numbers. When applying uniform sampling or percentile-based aggregates, the resulting number will be biased toward the experience of high-activity users.
In a low-intent context where users don't need to stick around (e.g. Twitter), high performance typically correlates with high activity, so the metrics will not account for users that would have used the app if the performance was better. So a good performance number could hide really poor performance that led customers to not use the app. A possible solution to avoid this is to get a single number per device (or per user) and then aggregate that single number.
In a high-intent context where users absolutely need to use the app (e.g. to take a payment), aggregates are more likely to represent the full spectrum of users, and high activity often maps to customers that are more important to the business.
Capturing these metrics correctly is hard
Both Google & Apple have failed to provide useful performance observability APIs that would allow app developers to easily track user-centric performance metrics.
Observability vendors do provide SDKs that track these for you, the problem is, they all do a terrible job of it. Seriously.
Example 1: app launch
The guidance and tooling for measuring app launch time on Android is lacking and inconsistent, let's dive into the details.
Play Store Android Vitals
The Play Store Android Vitals provide sampled & anonymous aggregate data on cold, warm & hot launches.
There's no ability to slice & dice based on custom properties so it's really hard to use it to investigate or build a metric aligned with business needs.
There are no details on how the tracking is implemented. I had to look into the AOSP sources!
The PlayStore reads data from an internal log tracker (not logcat), which the system_server process writes to. The reported launch time is the same value as what's logged to logcat by ActivityTaskManager on startup:
I/ActivityTaskManager: Displayed com.example.logstartup/.MainActivity: +1s185ms
I investigated the logged values in How adb measures App Startup 🔎 . That investigation surfaced that:
The measured start time is when system_server receives the activity start intent, which can add a long time (in my debug test: ~300 ms / 30% of app startup) before the point where app developers have an influence (which is when the APK file starts loading).
The measured end time is the timestamp of when the window of the first resumed activity is done drawing.
Jetpack Macrobenchmark
Macrobenchmark pulls its launch time data from Perfetto, which computes it based on atrace logs. For example the ActivityMetricsLogger.LaunchingState constructor starts a trace:
LaunchingState() {
if (!Trace.isTagEnabled(Trace.TRACE_TAG_ACTIVITY_MANAGER)) {
return;
}
sTraceSeqId++;
mTraceName = "launchingActivity#" + sTraceSeqId;
Trace.asyncTraceBegin(Trace.TRACE_TAG_ACTIVITY_MANAGER, mTraceName, 0);
}
The trace is then pulled by Perfetto.
In summary, Jetpack Macrobenchmark, Perfetto, Play Store Android Vitals and logcat all report almost (Perfetto traces are started with a small offset) the same value. That's great, though it should be more systematically documented.
Unfortunately, measuring app launch time in-app to report production analytics is a different story.
Production analytics
Most implementations capture cold app launch by measuring:
Both the measured start and end are incorrect yet that's exactly what Firebase Analytics is doing:
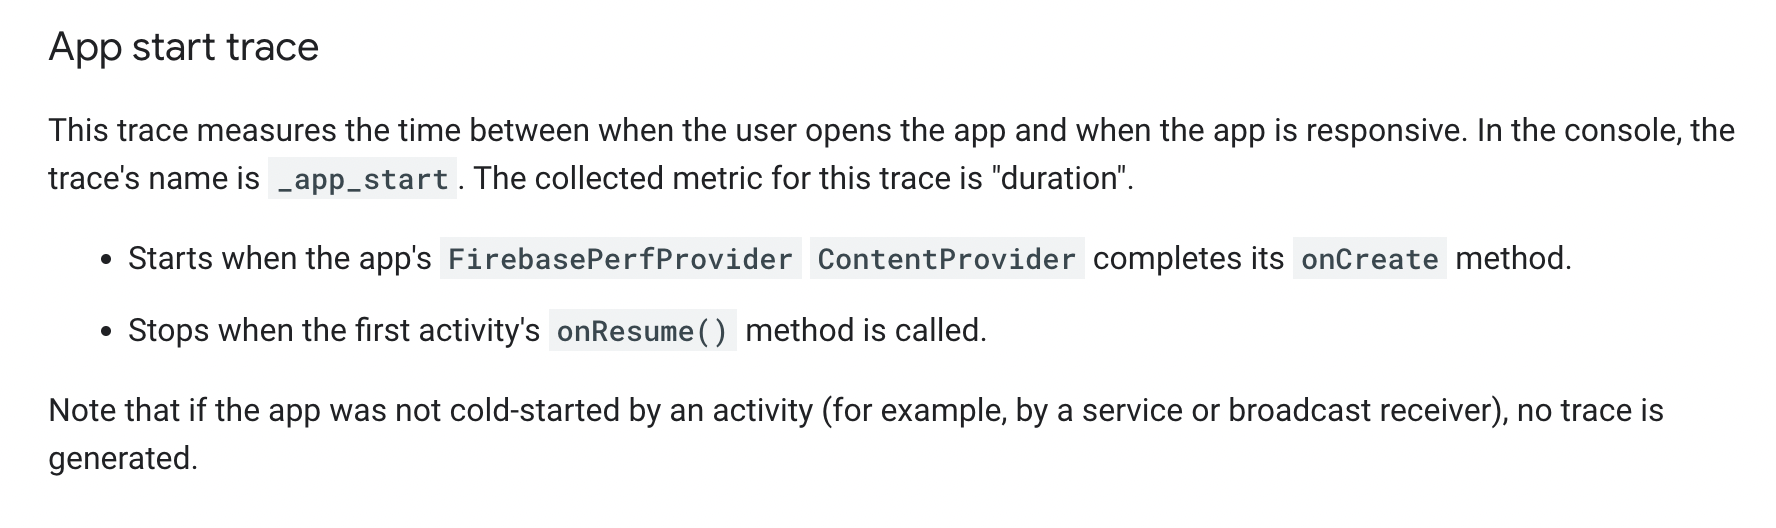
This approach is incorrect for several reasons:
This doesn't track hot launch & warm launch, which the Play Store Android Vitals reports.
This also includes in the cold launch count cases where the process is first started in background for unrelated reasons and then an activity is a bit later launched (within e.g. a minute of process start). This will inflate the aggregate durations of cold start launch metrics and should not be accounted for. These fake cold starts should be ignored, by looking at process importance in Application.onCreate() and making sure that the first Activity.onResume() happens before a main thread post scheduled from Application.onCreate() (see Android Vitals - Why did my process start? 🌄).
The start time is entirely disconnected from what Play Store Android Vitals report: the loading of a random class or a ContentProvider.onCreate() call happens long after system_server receives the launch intent.
Unfortunately, there's no API that provides the launch intent timestamp. There should be! Actually I just found out there's Process.getStartRequestedUptimeMillis() since API 33.
Process.getStartUptimeMillis() (API 28+) is captured right before APK loading and is a much better option for reporting launch start than ContentProvider.onCreate() or class load time. Unfortunately real production data surfaced that on API 28+ we sometimes get start times hours in the past (see Android Vitals - When did my app start? ⏱).
The end time should be when the first frame traversal after first activity resume is committed (see ViewTreeObserver.registerFrameCommitCallback. The first traversal is likely to involve quite a bit of work, and capturing the end in Activity.onResume() ignores all that work.
I ended up writing a longer article on how to do this right: Tracking Android App Launch in production.
Example 2: tap interaction latency
Observability vendors provide APIs to record spans. It's tempting to use spans to record the latency of an interaction, for example here how long it took to navigate to the About screen when tapping on the About button:
showAboutScreenButton.setOnClickListener {
  val span = tracer.buildSpan("showAboutScreen").start()

  findNavController().navigate(R.id.about_screen)

  span.finish()
}
Unfortunately, this doesn't account for the actual customer experience, as there's a lot of work that happens between when the finger leaves the screen and when the click listener is invoked, as well as between when the view hierarchy is updated and when the change is visible on display. Here's a Perfetto trace that demonstrates this common mistake:
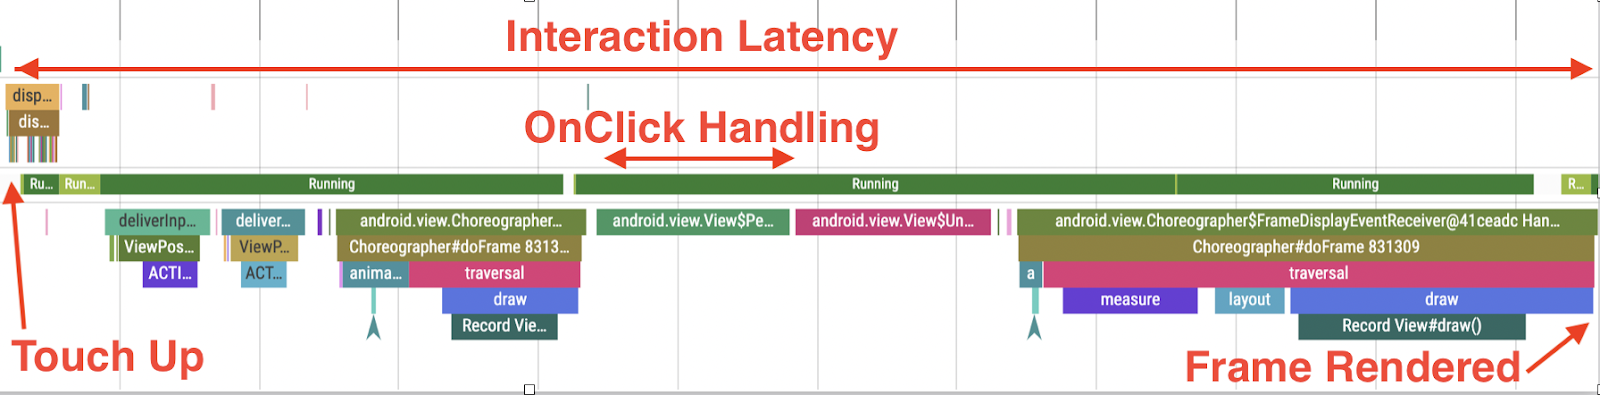
App developers often don't have the bandwidth to dive into this complexity and end up using incorrect but easier to implement measurements.
A better way?
App launch
Here's what we need from Google:
Documentation that covers how all tools across the ecosystem (Play Store Android Vitals, Logcat, Perfetto, Macrobenchmark) currently measure app launch times (for cold, hot and warm start).
New Android APIs to access the timestamp of when the launch activity intent was received by system_server. This exists now, very cool!
An Android SDK that implements the correct way to track app launch as highlighted in the section above. This should include cold start, warm start, hot start. I followed up and wrote an in-depth article on how one might go about that: Tracking Android App Launch in production
Firebase (and 3rd party vendors, OpenTelemetry, etc) could then use that SDK.
Going forward
My long term goal with these articles and the square/papa library is that either Apple & Google step up and provide strong guidance and more useful observability APIs (e.g. JankStats), or we come together as a community and build solid foundational open source measurement SDKs.
Let's start a conversation! You can reach me on Mastodon, Bluesky, Threads or Twitter 🙃.
Header image generated by DALL-E.