Fixing simpleperf broken records

Summary
This blog shows how to fix simpleperf traces which are otherwise unusable because they include samples with truncated callchain roots. Read on to learn more about what these crazy words mean!
Profiling Android apps
As an Android developer, I have many tools available to profile your Android apps. I typically use:
- System-level span based tools (systrace, Perfetto) to get a good picture of the system-level app behavior. I usually start there, to answer questions like "Are the app threads fully utilizing the CPUs or waiting for IO or IPC (aka binder calls)?" or "Are other apps running in parallel, interacting with the app or starving CPUs?".
- App-level stack sampling tools (sample Java Methods, simpleperf) to get a better understanding of what's going on inside the app, see what code is executing and how long each method call is taking.
simpleperf
According to the Readme:
Simpleperf is a native CPU profiling tool for Android. It can be used to profile both Android applications and native processes running on Android. It can profile both Java and C++ code on Android.
The general idea is that it runs with less overhead than the good old sample Java Methods, so the results are closer to reality.
In the past, I tried to follow the command line instructions to profile an Android application with simpleperf, but I never fully understood how to use it.
I only recently realized that simpleperf has been integrated into Android Studio for a while, under the option "C / C++ trace recording". In Android Studio Bumblebee, the option was renamed to "Callstack sample recording" and "sample Java Methods" became "legacy".
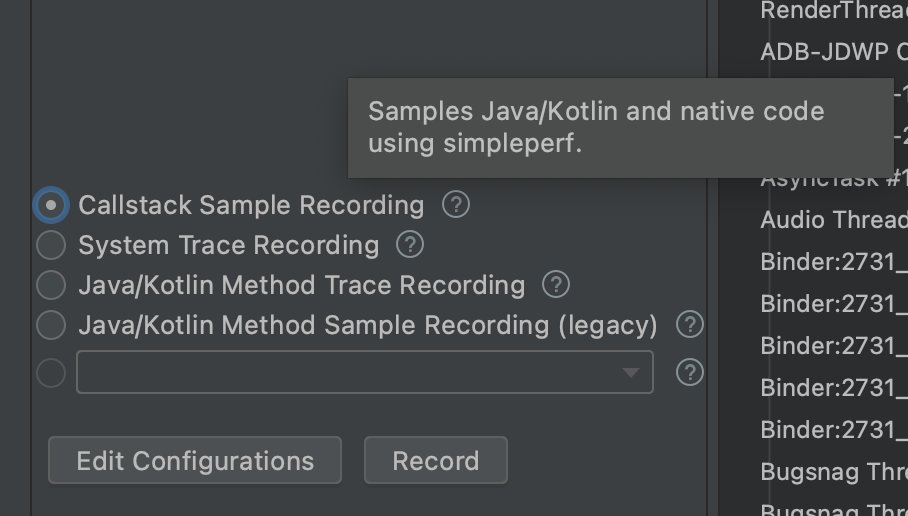
Note: Debug.startMethodTracingSampling() is still the only available API for instrumentation despite being the exact same thing as the now legacy "sample Java Methods", although apparently starting with API 29 we can now invoke simpleperf from code.
Unusable traces
When I record a simpleperf trace from a complex app, here's the result:
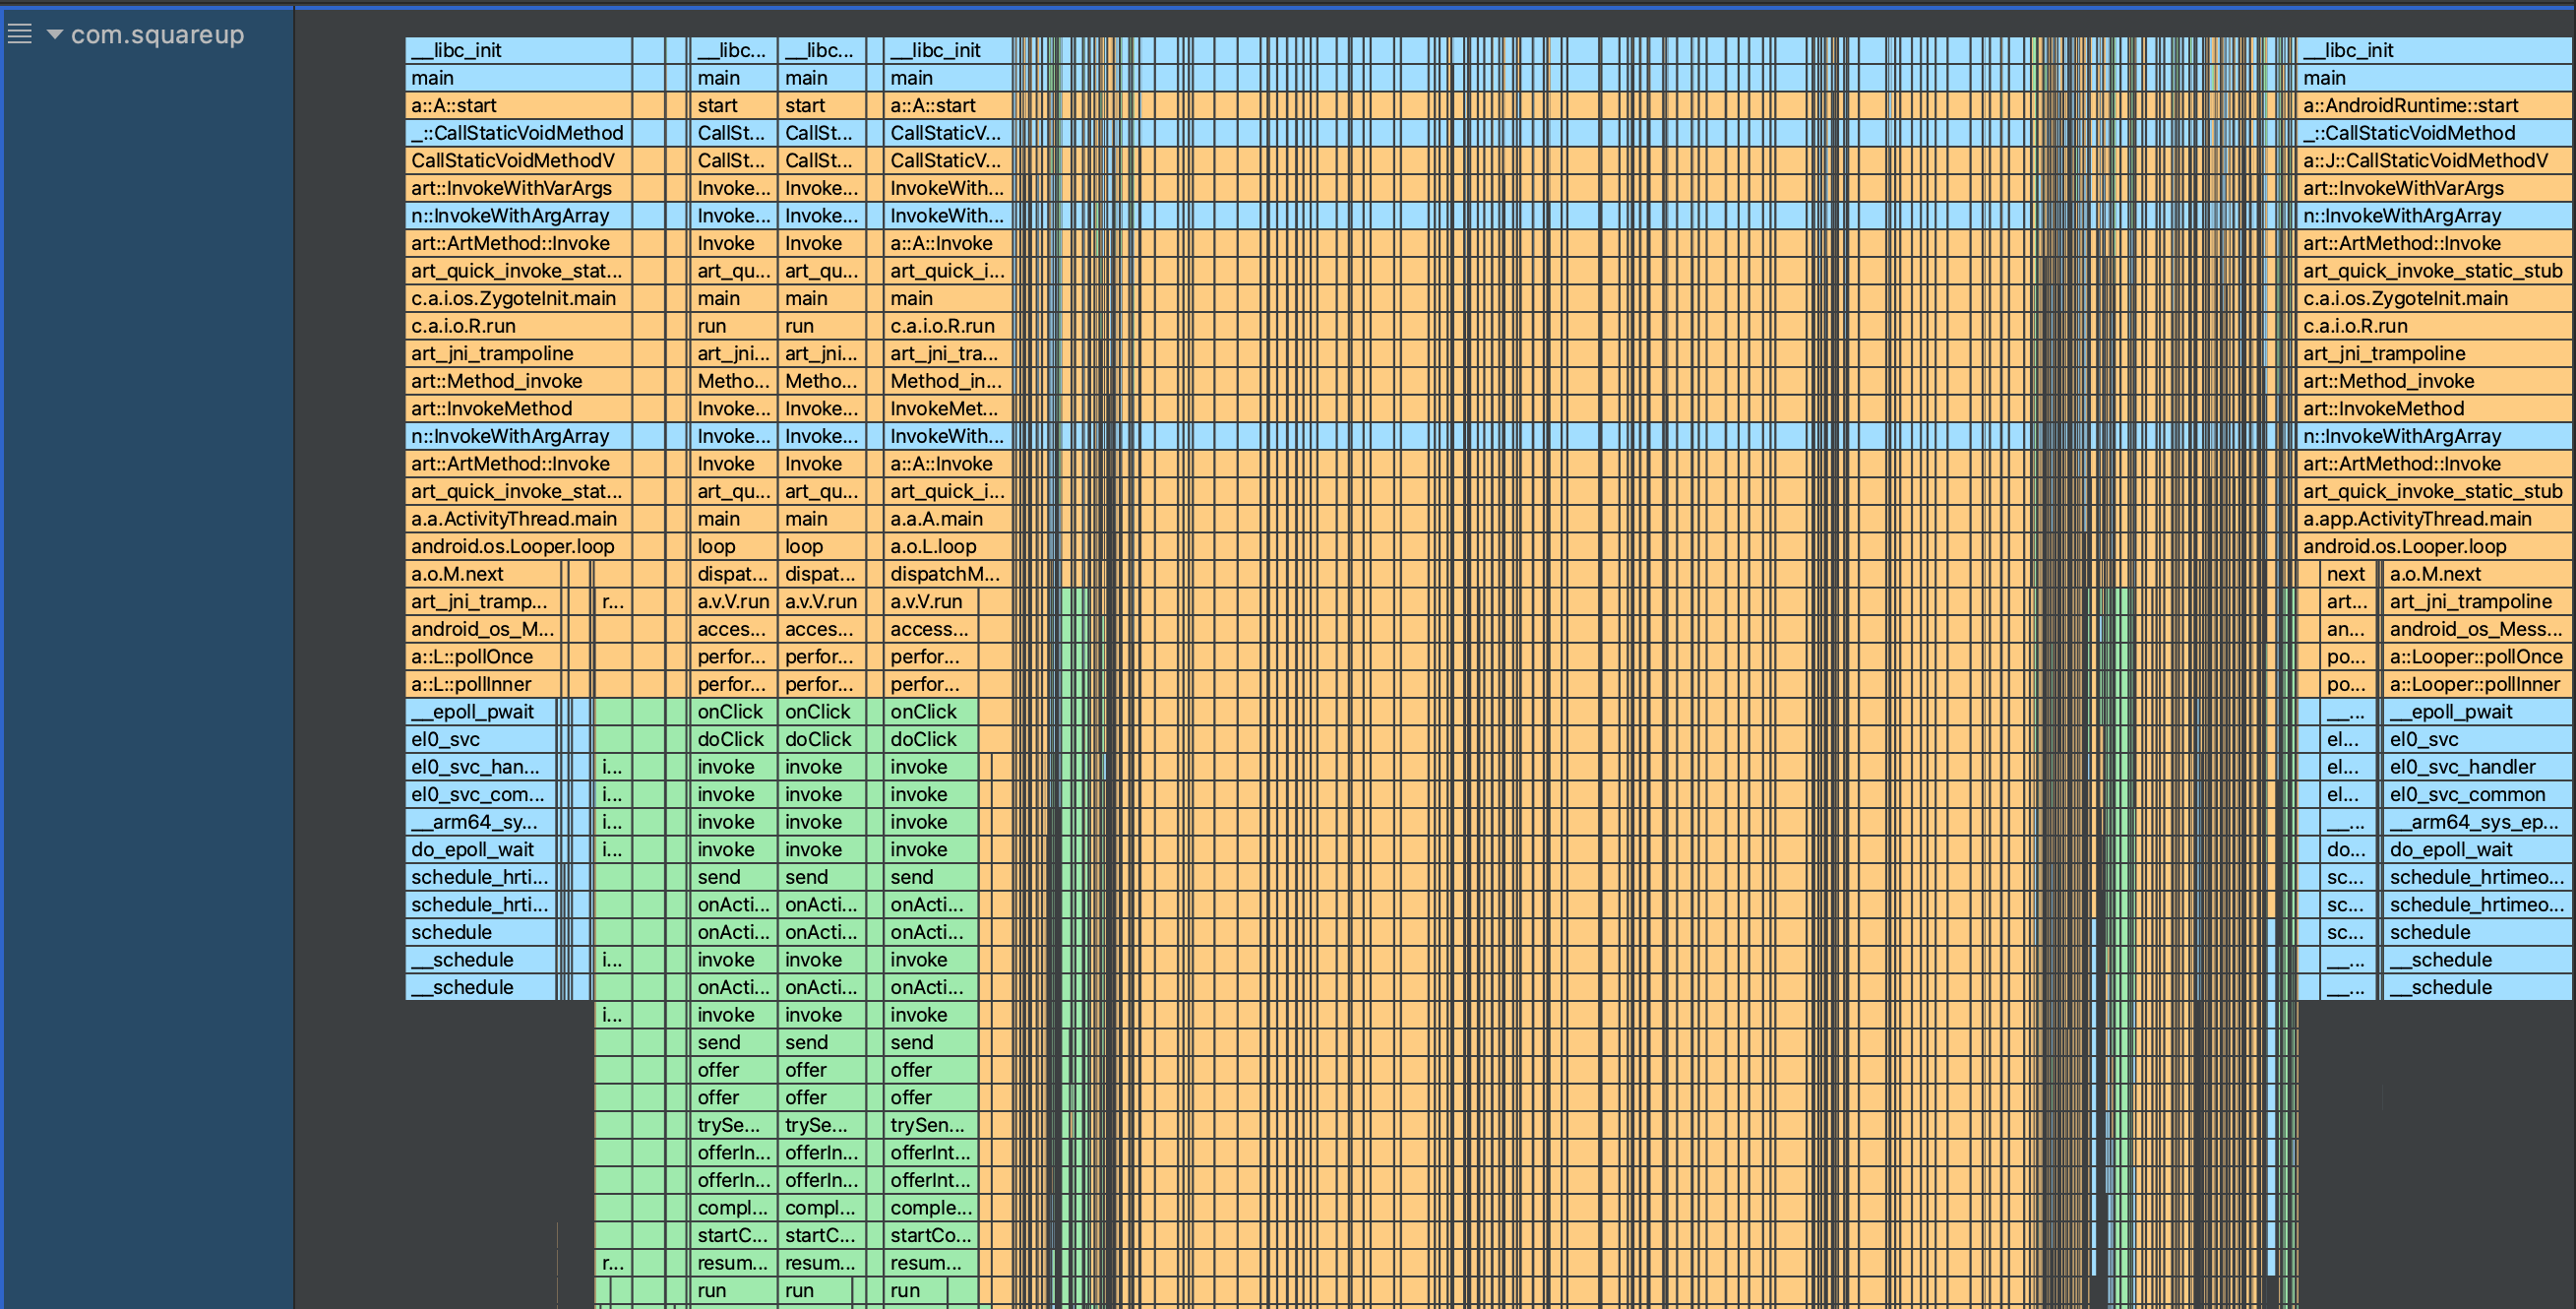
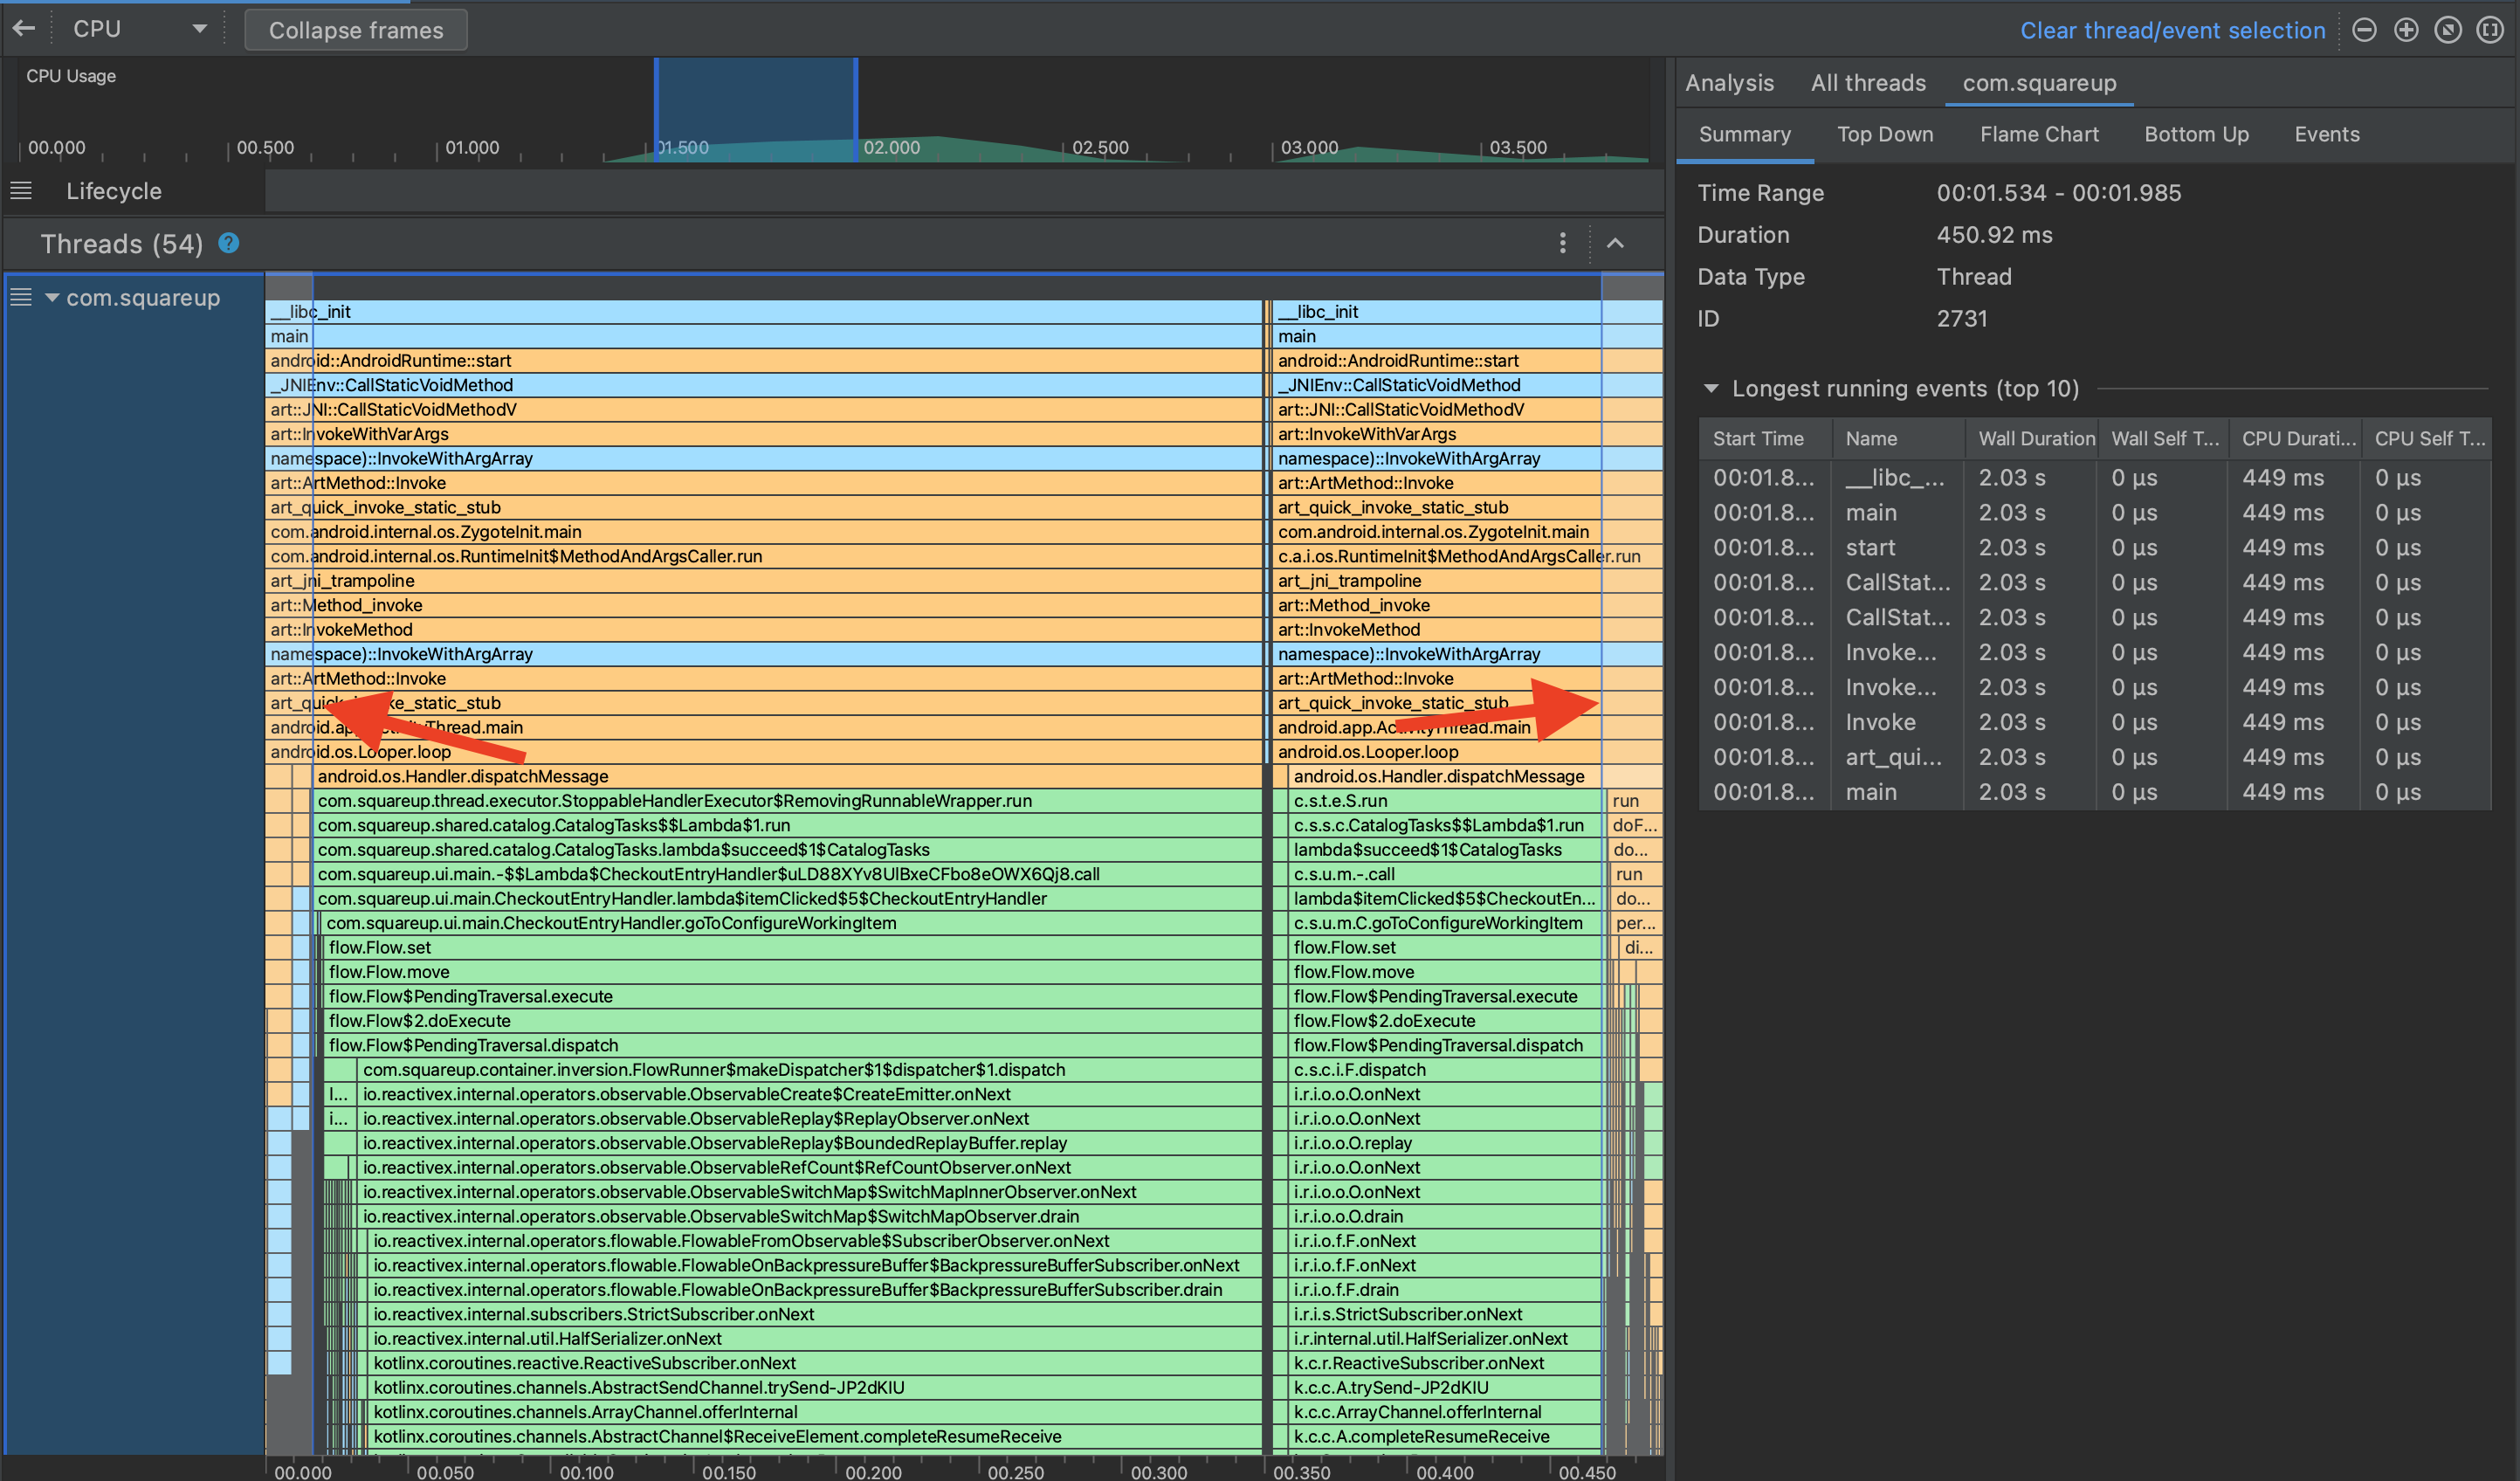
Notice the many thin grey vertical lines that break up the main thread call tree, all the way from the top. That's weird!
If you zoom in, you can see that the left and right spans around these vertical lines are identical stacks:
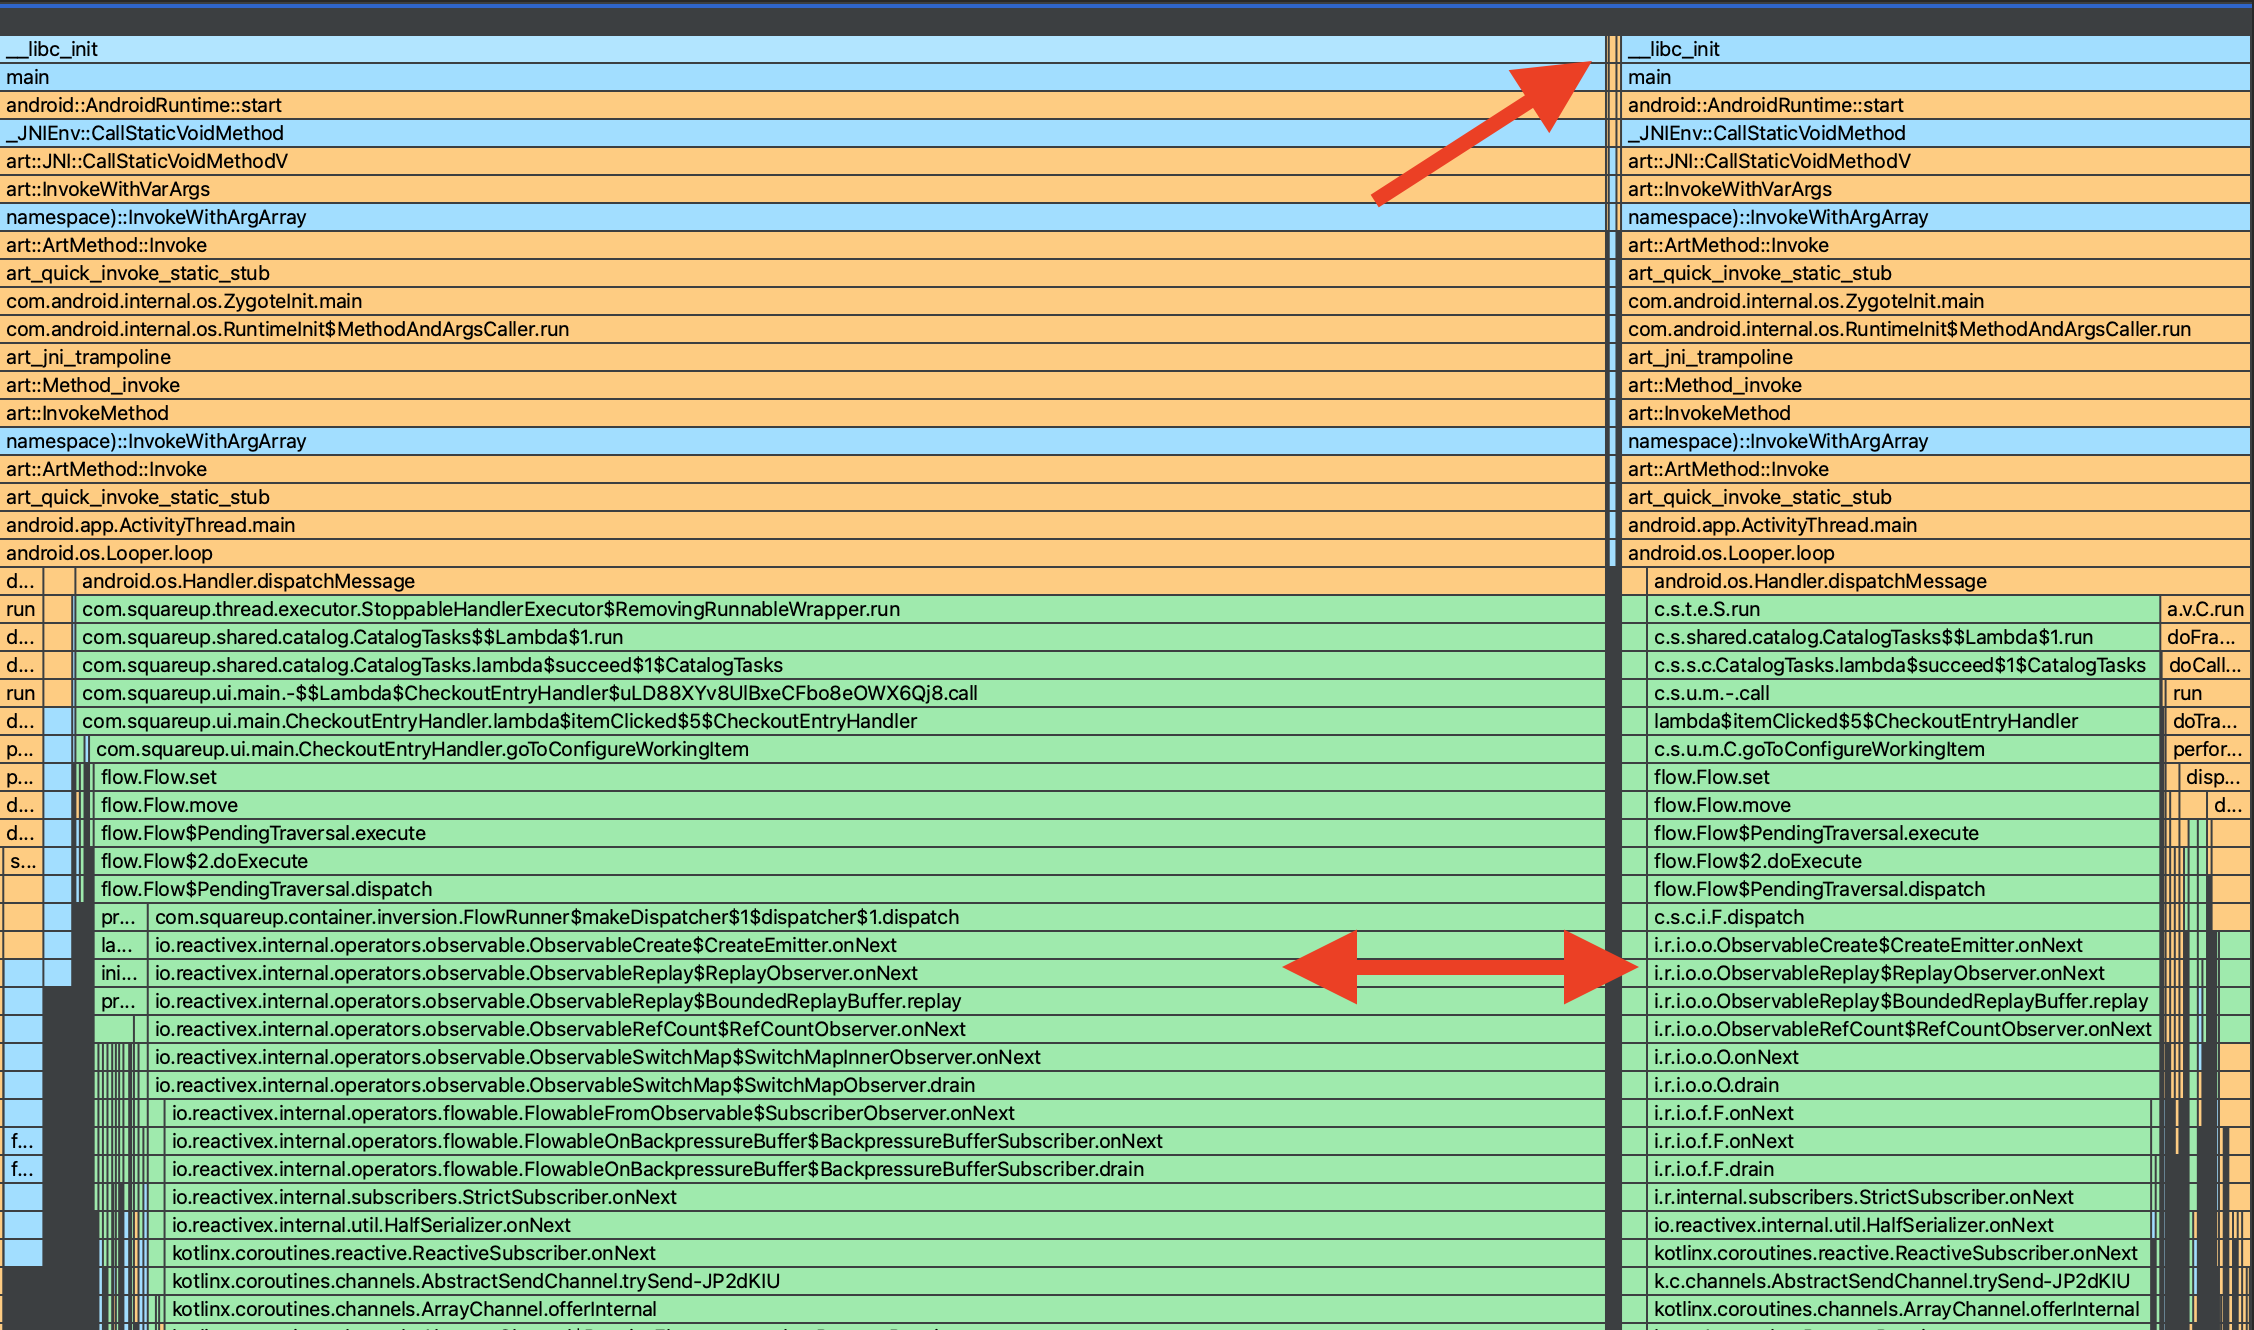
These should be just one giant call stack, not two stacks separated by a weird tiny stack. What's going on?
If you run into this issue, you can work around it by selecting a time-based span manually for the analysis. It works but it's not great.
DWARF
Simpleperf generates DWARF-based call graphs. I have no idea what that means, but the simpleperf FAQ mentions it:
Why can't we always get complete DWARF-based call graphs?
DWARF-based call graphs are generated by unwinding thread stacks. When a sample is generated, up to 64KB of stack data is dumped by the kernel. By unwinding the stack based on dwarf information, we get a callchain. But the thread stack can be much longer than 64KB. In that case, we can't unwind to the thread start point.
To alleviate the problem, simpleperf joins callchains after recording them. If two callchains of a thread have an entry containing the same IP and SP address, then simpleperf tries to join them to make the callchains longer.
In other words: for each thread stack sample, simpleperf can only capture the first 64KB at the top of the stack, and stitches it all back as a full callchain by finding the rest of it in other samples that share some common callchain entry. That's very cool!
Unfortunately, if the stack changes significantly in between consecutive samples, then simpleperf cannot find any common callchain entry, so it just keeps those truncated callchains in. Which explains why our call tree was broken up by weird super-thin vertical bars!
Stitching it back
I tweeted about this bug in October 2021 and then moved on with my life. But recently I've been using simpleperf again and I decided to see if I could fix the trace files.
I realized that those bad stack samples should be easy to spot, as they don't have the same root frames as every other sample (e.g. __libc_init followed by main). Once spotted, I can fix the bad stack samples by prepending a fake callchain based on the good samples that surround the bad sample.
Cool, let's write a trace parser! Fortunately, I found the Android Studio implementation: SimpleperfTraceParser.java.
I spent a few hours (mostly fighting gradle and protos) adapting it to do what I wanted:
if (sample.callchainList.last() == callStackRoot) {
  if (brokenRecords.isNotEmpty()) {
    // Reversed so that root is at index 0
    val lastCallchain = lastValidSample.callchainList.reversed()
    val nextCallchain = sample.callchainList.reversed()

    var divergenceIndex = 0
    while (divergenceIndex < nextCallchain.size
      && divergenceIndex < lastCallchain.size
      && lastCallchain[divergenceIndex] == nextCallchain[divergenceIndex]
    ) {
      divergenceIndex++
    }
    val sharedCallChain = nextCallchain.subList(0, divergenceIndex)
      .reversed()

    for (brokenRecord in brokenRecords) {
      output.writeFixedRecord(brokenRecord, sharedCallChain)
    }
    brokenRecords.clear()
  }
  lastValidSample = sample
  output.writeInt(recordSize)
  output.write(recordBytes)
} else {
  brokenRecords += record
  brokenMainThreadSampleCount++
}
Once a trace is fixed, I can import it in the Android Studio profiler:
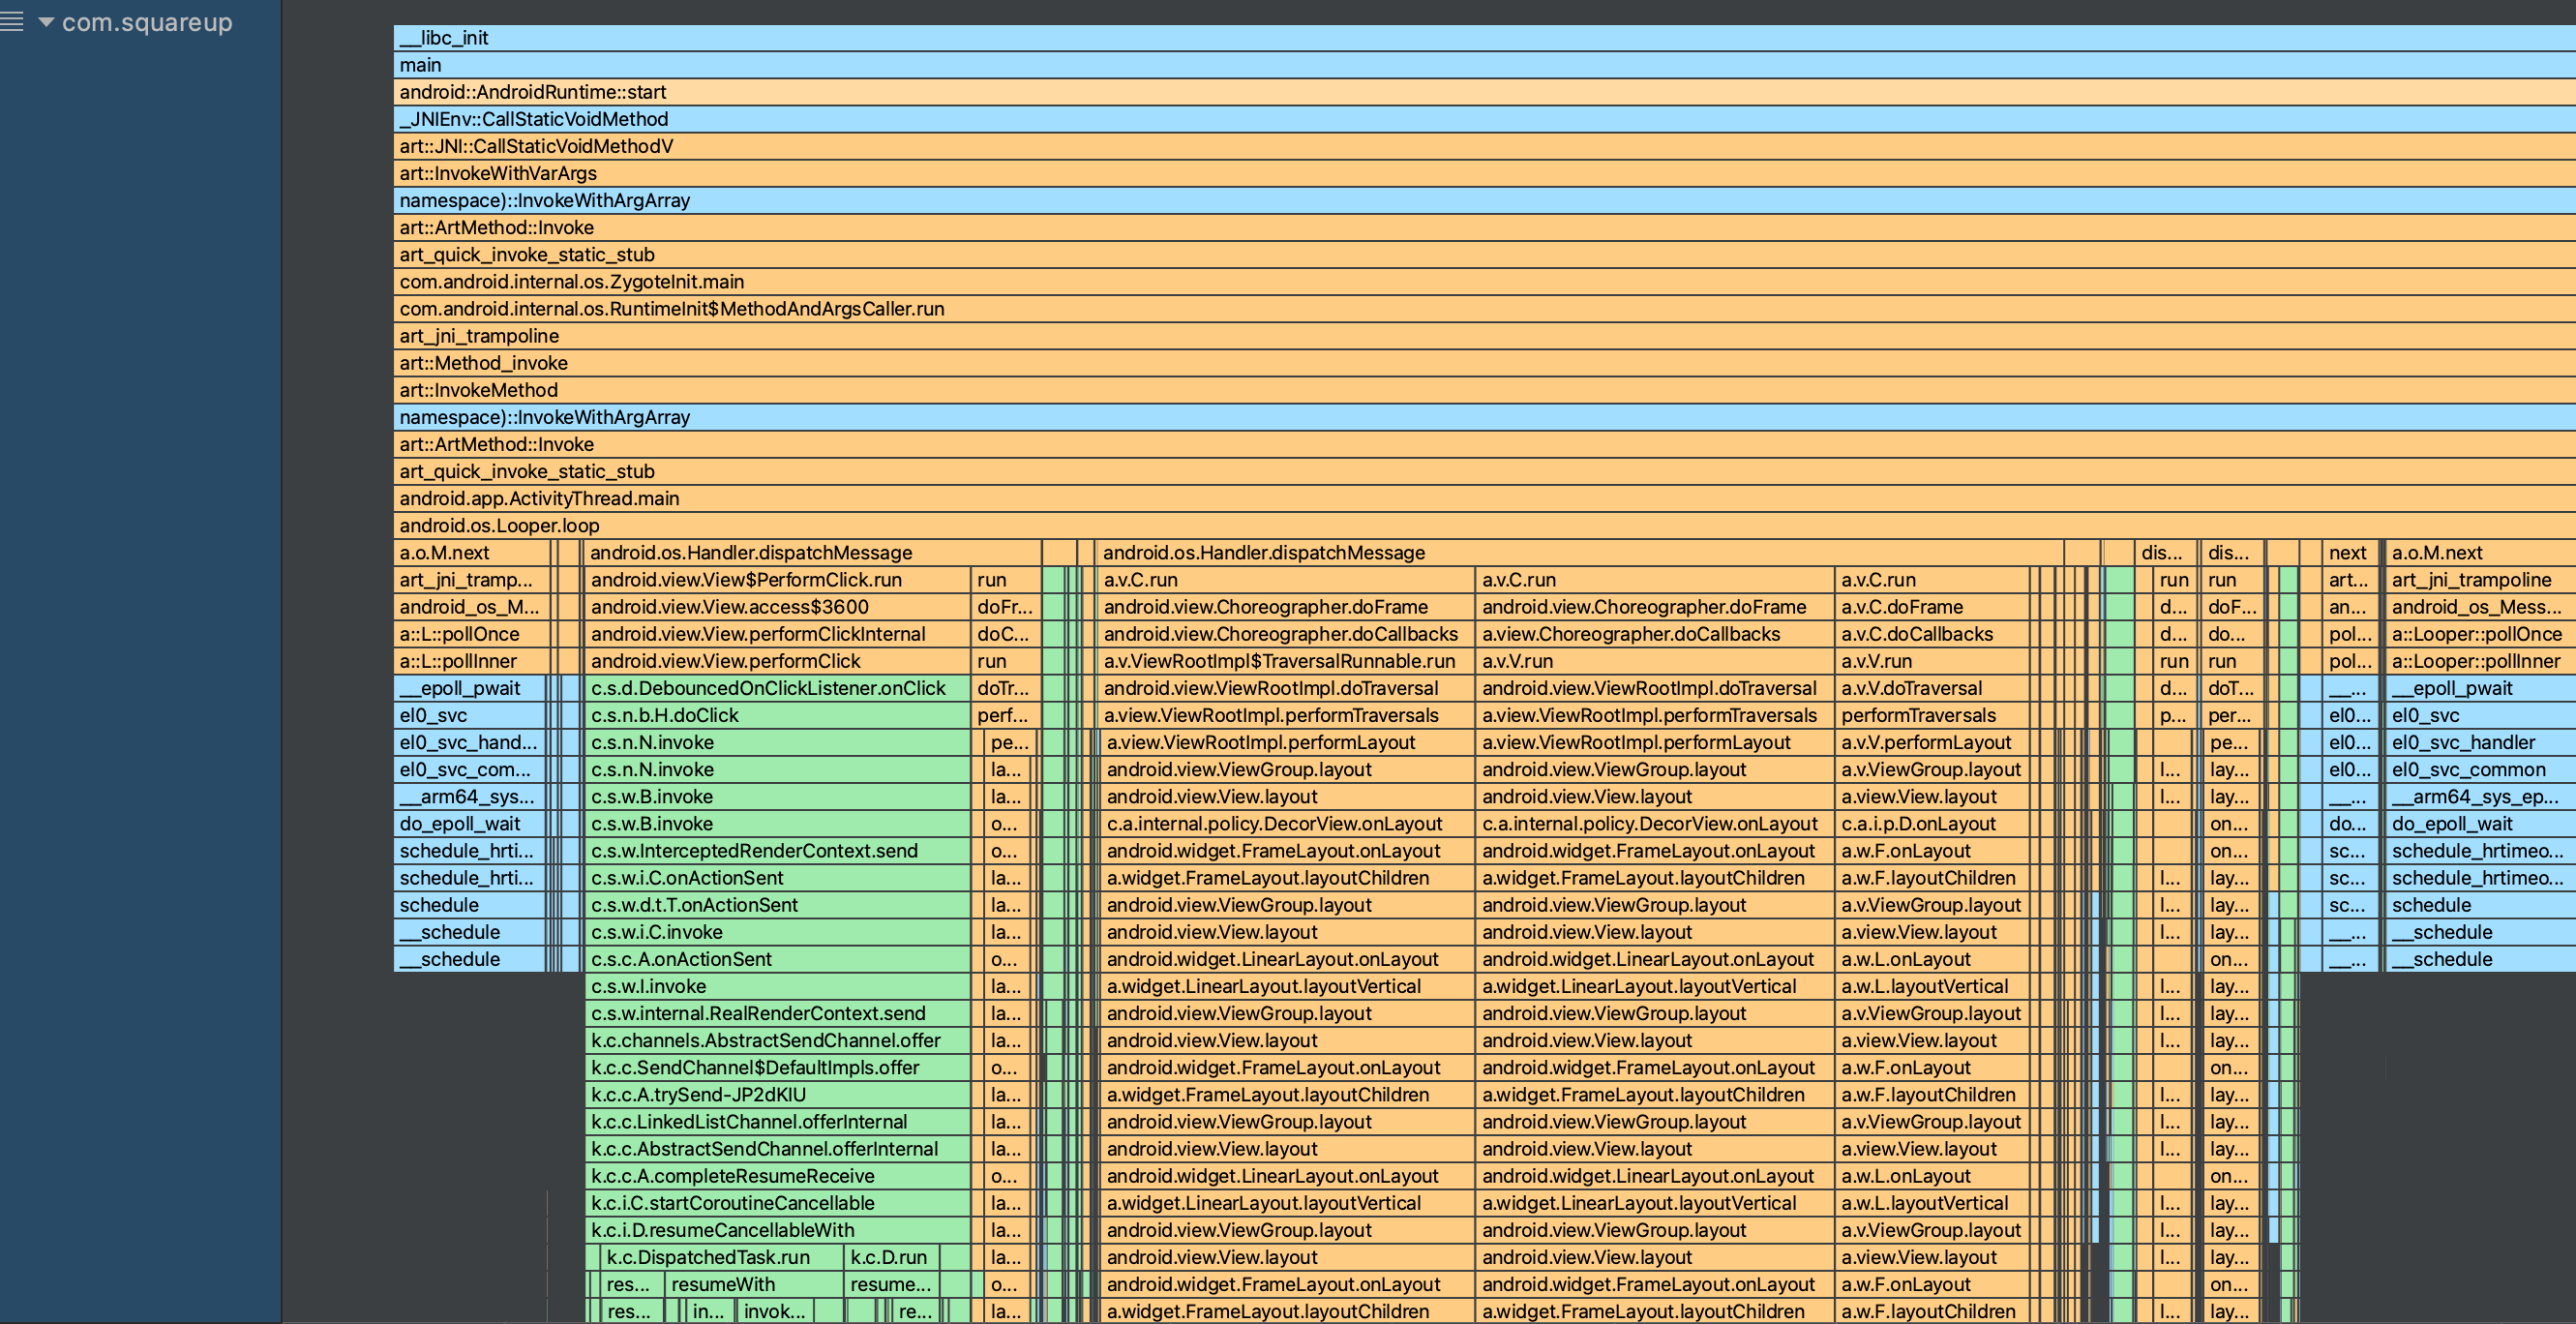
Much better!
Conclusion
The code is available at github.com/pyricau/simpleperf-cleanup.
I considered releasing it as a library or a CLI tool, but I figured, for now, anyone can use it reasonably easily:
git clone git@github.com:pyricau/simpleperf-cleanup.git
cd simpleperf-cleanup

./gradlew app:run --args="PATH/TO/TRACE.trace"
Hopefully, this will eventually be fixed in simpleperf or AndroidStudio and we won't need this hack (the Android Studio team is aware).
This hack also made me realize it wouldn't be too hard to build additional tooling on top of simpleperf traces, e.g. to support SQL queries or code-based investigations, or new types of graphs. Stay tuned!
Cover image: Dead Tired by Romain Guy.
About the author
- My pronouns are he / him. Android Engineer at Square / Block. A few things I enjoy: Publishing Open Source libraries (LeakCanary, Curtains, Radiography, square/logcat) Rollerblading Writing technical blogs (previously on dev.to/pyricau) Cooking Giving tech talks Reading sci-fi
Comments
Join the discussionNo comments yet. Be the first to comment.